On 29 October the Chancellor Philip Hammond will present his Budget. It will draw considerable attention from the media as well as the general public. The few that have tax consultants will receive messages and documents explaining “what the budget means to you”.
This blog is part of a PEF series of informative pieces by our Council members on what the budget is, its probable impact on our economy and what it implies for the common citizen – a progressive “what the budget means to you”.
The Treasury, via the Chancellor, announces its annual budget in the autumn, usually in November. This year the Chancellor brought the date forward because in November the Commons agenda might be clogged with issues related to Brexit. The last annual budget statement, on 22 November 2017, projected 2018-19 expenditure of £809 billion and revenue at £769 billion. The coming budget will have quite similar numbers.
Closely following international convention, our government divides its expenditures into “current” and “capital” categories. The current category includes wages and salaries, NHS drugs and other materials consumed within the budget year (which goes from 1 April to 31 March). Capital spending refers with few exceptions to construction projects and expenditures on equipment with a life longer than the budget year plus depreciation of fixed assets.
More recent statistics (see Tables PSA6c_2 and _3) show total annual central government expenditure (September 2017 through August 2018) as £778 billion, of which £718 billion was the current account and £60 billion the capital account. Total central government spending calculated at 36.8% of gross domestic product (GDP), with current expenditure by far the larger part: 34.6% of GDP for current spending and 2.9% for capital.[1]
This somewhat overstates the government’s commitment to investment, though. Once local government[2] and depreciation – roughly speaking, the loss of value in existing assets due to wear and tear – are taken into account, net investment across the public sector[3] is even lower, around 1.8% of GDP.
To better understand the budget statement, it is useful to divide current spending into three sub-categories: interest payments on the public debt, recurring expenditures, and expenditures sensitive to economic fluctuations. The size of and interest rates on outstanding public debt determine interest payments. These expenditures involve long term, contracted payments that cannot be reduced without flirting with debt default.
Recurring expenditures, funding for schools, the NHS, pensions, transfers to local government, defence and other government departments are relatively fixed and predictable (explained further in Michael Davies’ blog on the spending envelope).
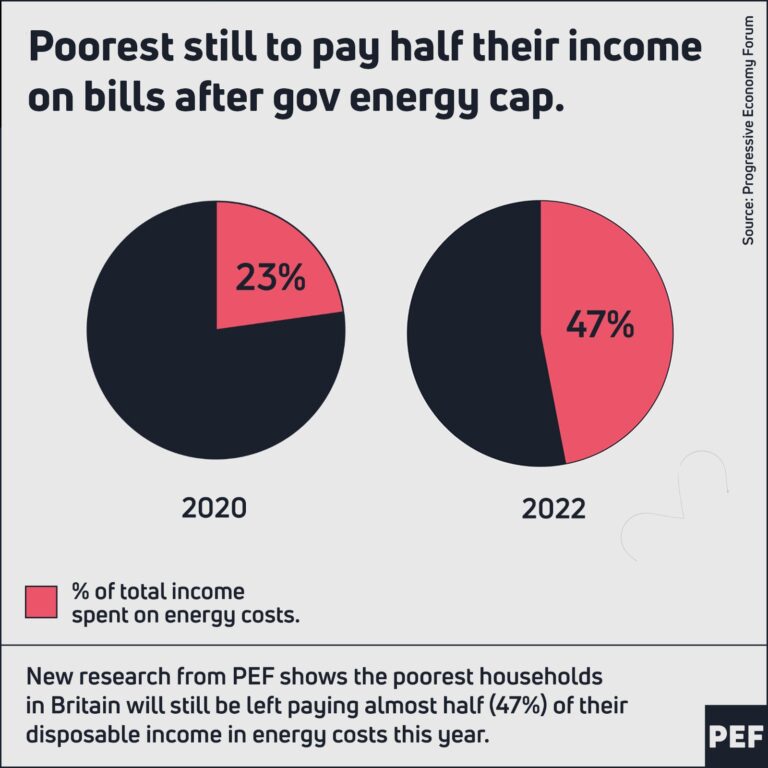
Least predictable are expenditures that are sensitive to the health of the economy. The most obvious of these are payments to the unemployed, which rise during recessions and fall during expansionary periods. These expenditures, approximated by the “social assistance” category, represented about 14% of current expenditure and 4.8% of GDP in the year up to August 2018. If actual expenditures differ from what is planned, this is usually because social support proves larger or smaller than expected, due to unanticipated fluctuations of the economy as a whole. On the tax side economic fluctuations also undermine predictability; revenue grows more slowly or falls in recessions and expands during recovery.
Over the eight years of austerity the major cuts in spending have fallen on public investment and transfers to local government. The annual budget of 2006/2007, just before the financial crisis, allocated over 22% of current spending to local government grants. In the 2017/2018 budget that share fell to less than 17% (Table PSA6e_2).
One of the least important issues in the Autumn Statement will be the fiscal balance, though it is certain to capture headlines with such dubious metaphors as “budget black hole” and “living beyond our means”. As explained in blog #6 of PEF’s 100 Policies to End Austerity series, a balanced fiscal budget is a political target, not an economic one. Over the 12 months through to this July, total expenditures exceeded revenue by a modest £32 billion, just over 1.5% of GDP.
To make sense of the coming budget statement the first step is to ignore the media obsession with whether the Chancellor has or has not reduced borrowing. Whatever happens to that number (called “public sector net borrowing” or PSNB) will be the consequence of unpredictable factors impacting on both expenditure and revenue.
Because our economy has expanded quite slowly over the last year, revenue may well fall below Treasury projections. Any difference from projections is likely to be trivial, no more than a random variation. The important issue is whether the 2018/2019 budget will enhance or further undermine the well being of the population. The PEF blog series on the 2018 Budget focuses on that issue – will the next budget bring further austerity or, at long last, a step towards enhanced well-being?
[1] GDP figure used for this period is 12 month centred moving total for August 2018 inferred from Table PSA1.
[2] Capital grants (grants ear-marked for investment) from central government to local government contribute to central government net investment but detract from local government net investment, to avoid double-counting. Once intragovernmental capital grants and depreciation are taken into account, net local government investment is negative.
[3] Excluding public sector banks, i.e. RBS.