The Progressive Economy Forum takes its analytical inspiration from the work of the greatest economist of the 20th century, John Maynard Keynes. Like all great thinkers Keynes offered insights in many areas of macroeconomics. His basic macroeconomic framework provides us with the tools to investigate the overall impact of austerity.
How much of our economy’s potential output we achieve depends on demand. The demand for output, total national expenditure, divides into four components 1) spending by households (consumption); 2) spending by businesses on plant and equipment (private investment); 3) spending from abroad (net exports); and 4) public expenditure (both investment and current or “consumption” spending). In recent years household consumption and public expenditure add to about 95% of GDP, private investment 15% and net exports minus 10% (exports minus imports).
These national income categories predate Keynes, though he was the first to divide them into two analytical groups, expenditure that determines national income (GDP) and expenditures generated by national income. While the media frequently refer to “consumer led expansion”, this is a confused concept. Household consumption is the result of national income growth not a cause. As much as we might wish it otherwise, except briefly and for the very rich, households find their spending constrained by their incomes on domestic goods and imported items. This constraint also applies to borrowing, since a household’s income determines its capacity to carry debt (see the excellent book on household debt by PEF Council member Johnna Montgomerie).
Current national income, measured as gross domestic product (GDP), does not determine the other three categories of demand for output. Business investments last for several years and are made in anticipation of medium and long term sales and profit, not current sales and profit. Political decisions determine public expenditure, and the demand for exports is from buyers in other countries.
On the one hand we have those value flows determined by current national income (household spending, household saving, imports and taxes); on the other hand are those flows quite independent of current income, business investment, public expenditure and exports. The Office of National Statistic provides data on these flow categories, both those induced by current income and those independent of current income (“autonomous” with respect to income).
To put the causal relationships simply, investment expenditure determines the increase in the economy’s capacity to produce, and autonomous expenditure (including investment) determines how much of that capacity is utilized. Keynesian macroeconomic policy involves fostering investment in the medium term to increase the economy’s growth potential and managing autonomous demand to achieve that potential. As should be obvious, the government’s most effective instrument for short run demand management is its own expenditure.
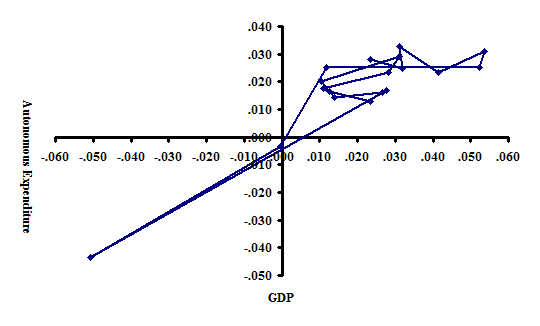
The chart shows changes in autonomous expenditure on the vertical axis and changes in GDP on the horizontal. A glance at the chart shows the two measures are closely related. When autonomous expenditure increases, GDP increases. A close fit does not imply causality. We infer causality from Keynesian theory, autonomous demand drives output. On average over the 19 years, a ten percent increase in autonomous expenditure resulted in a 6.6% increase in GDP.

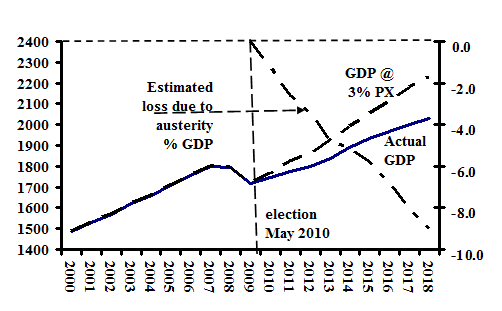
We can use the statistics from the chart to make a rough estimate of the effect of austerity on GDP growth after 2010. During 2010-2018 private investment increased at an annual rate of 3%. The annual rate of growth of exports was almost identical. During 2000-2008 the annual growth of public expenditure was also 3%, then 0.7% during the austerity policies of 2010-2018. One simple and straight-forward way to isolate the impact of austerity would be to calculate the implied increase in GDP during 2010-2018 if public expenditure had grown at 3% rather than 0.7% with no change in the growth of exports and investment.
The chart below shows the result of that calculation. From 2009 to 2018 the actual increase in GDP (solid line in the chart) was £236 billion or 14%. My calculations show that if public expenditure in those years increased annually at 3% instead of 0.7% the GDP increase would have been £437 billion (25%). By 2018 the gap between the actual outcome and the calculated non-austerity outcome was £200 billion. This implies that the austerity cost in 2019 alone was slightly over £3000 per capita.

The accumulated the difference between actual GDP and the non-austerity calculation over 2010-2018 was £965 billion, a net loss of £14,600 per capita, almost half of actual GDP in 2018. Simply stated, my calculations suggest that in 2019 Britain was nine percent poorer as a result of austerity.
Comparisons to estimates of the cost of Brexit help place the austerity losses in context. The Bank of England generated by far the most pessimistic Brexit estimates, with a “worst case scenario”, leaving the EU with no agreement, of 8%. The cost of Brexit with an agreement avoiding a “hard” Irish border shrinks to less than one percent. The accountancy group ICAEW has a much more modest cost estimate, £86 billion in direct cost since the June 2016 referendum, while Goldman Sachs calculates a loss of 2.4% of GDP over the same period (about £96 billion for the 24 months since the referendum). Finally and roughly in the same range, a Standard and Poor study sets Brexit GDP loss since the referendum at about £1000 per capita, compared to £14,600 for austerity policies.
As the Brexit process approaches its defining moment, it is clear that it has and will bear a considerable economic cost. However, that cost pales by the impact of ten years of austerity. By the middle of this year British residents will be one trillion pounds poorer as a result of austerity.
In 1990 the Burns Day Storm caused £3.4 billion in damage, winning the distinction of the most costly natural disaster on record. What nature wreaked in 1990 was trivial compared to the unnatural disaster of Tory austerity policies.
Photo credit: wandererwandering / Flickr


