The recent releases of labour market statistics by the Office of National Statistics have prompted positive commentary in the media, bringing the government some much needed favourable coverage. In May, for example, a Financial Times article declared: “UK unemployment rate drops to lowest level since 1974: Figures point to tightness in Britain’s job market despite Brexit impasse.”
However, what the ONS measures now as unemployment now is not what it measured 44 or even 25 years ago. Forty years ago the distinction between “employed” and “unemployed” was clear and binary. In 1980, 51% of UK employees were union members, which for most meant a decent-paying, regular job governed by a collective bargaining contract. Most non-union unemployment was also governed by contracts. Now, in 2019, the union membership rate has fallen to 22%, and the portion of the work force protected by collective bargaining has fallen more.
At risk of oversimplification, we can generalise that in 1980 the employed/unemployed dichotomy reflected a real dichotomy in the labour market. Now, “employment” is a much more ambiguous and fluid concept, as the ONS statistics show (see Table 3 in latest ONS labour market statistics report).
A recent editorial, also from the FT, summarises well the contemporary UK labour market:
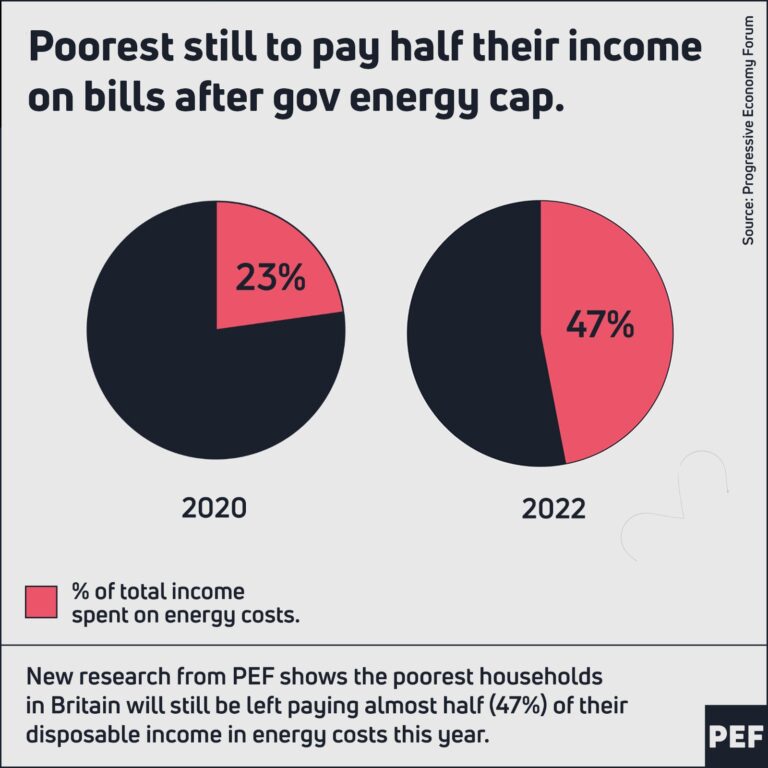
…2.8m people in poverty live in families where all adults work full time. That is a challenge to the intellectual basis of welfare reforms for the past 30 years, including on the centre left. Bill Clinton’s embrace of workfare was meant to tackle “dependency” and promote personal responsibility; Tony Blair’s New Deal aimed to get people into work and keep them there; and Gerhard Schroeder’s Hartz reforms have led to the rise of precarious and low paid “minijobs” in Germany.
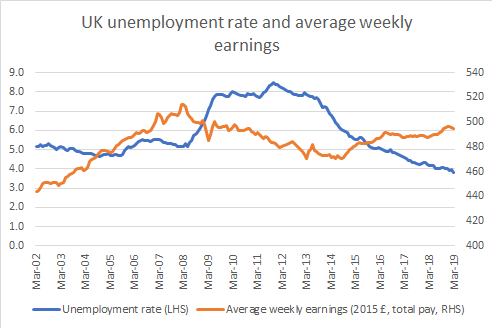
The growth of precarious and unstable employment explains why consistently falling unemployment has not led to consistently rising wages. The chart below shows the two variables, average weekly wages at constant prices (left axis) and the overall unemployment rate (right axis). The chart shows that, between 2013 and 2019, wages have risen while unemployment has fallen. The probability that this wage-unemployment link is actually random over those seven years is less than one in a thousand. But the relationship is very weak – real wages and their annual growth rate are still below their pre-crash levels despite ‘record low’ unemployment.

Source: ONS, Tables 2 and 16. Figures are overlapping three month averages to the given date (e.g. Mar 2002 = average in Jan-Mar 2002).
This is what we would expect from the transformation of the UK labour market over the last few decades. In the 1960s and 1970s, a fall in unemployment necessarily implied a “tightening” of the labour market: fewer people looking for work and more companies seeking workers. This tightening meant that competition among private employers to fill vacancies increased, putting upward pressure on wages.
Now, a change in the unemployment rate does not necessarily imply a tightening of the labour market. Instead of a straightforward move from unemployed to employed, a tightening of the labour market might now involve a shift from temporary to permanent employment, from part-time to full-time status, or from self-employment to employment proper. All of these shifts – and their reverse – could occur with no change in measured unemployment. This conclusion is obvious given the ONS definition of “employed”:
The number of people in employment in the UK is measured by the Labour Force Survey (LFS) and consists of people aged 16 years and over who did one hour or more of paid work per week and those who had a job that they were temporarily away from.
The definition creates the perverse possibility that the overall unemployment rate could fall while the actual amount worked by people also falls; i.e. a lower unemployment rate with lower employment. This apparently nonsensical outcome actually occurred in recent months. The measured unemployment rate for January-March 2019 was 3.8% compared to 3.9% for December-February 2019, even though the “total in employment” fell by 24,000 and the number of employees fell by a striking 118,000, only partly compensated by self-employment rising 98,000 (see ONS Table 3, columns B and C).
How can the unemployment rate fall when the number of people employed in all categories declines? The obvious answer, not covered above, is a fall in those defined as “economically active”, specifically in the category of people without work but seeking work and unable to obtain it. Back before the ideological hegemony of neoliberalism, the “economically inactive” were known as “discouraged workers”: people who gave up seeking work because there was none to find (see explanatory video and the US Bureau of Labor Statistics’ technical explanation).
In summary, the Financial Times headline, “UK unemployment rate drops to lowest level since 1974” was correct but incomplete. It would have accurately stated, “UK unemployment rate falls with fewer in work and fewer seeking work”.
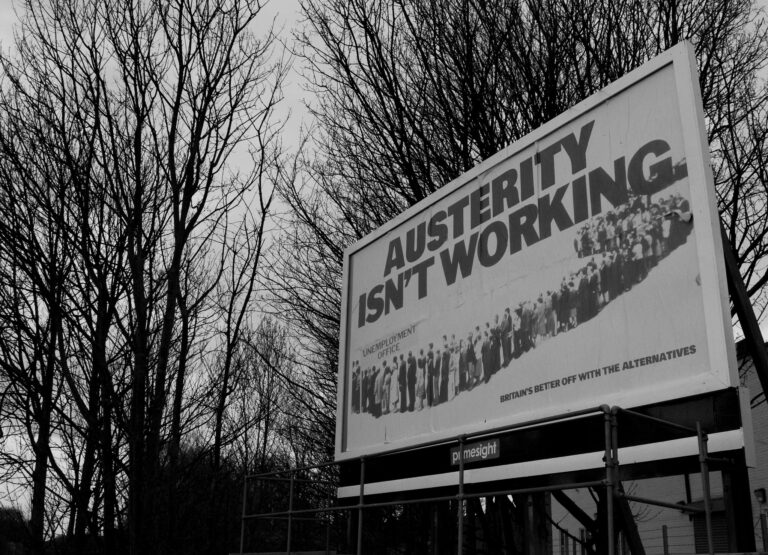
There is perhaps no better example of the economic distortions of an austerity-ravaged, neoliberal economy than a lower unemployment rate when fewer have work. A look at the numbers below the headlines is never a bad idea in this brave new world.
Photo credit: Lydia / Flickr


